Increase app revenue? First find the ads that trap users
Our transit app's ad income looked healthy while some ads trapped users. How we counted it, what we switched off, and what the numbers did next.
Most advice on how to increase app revenue starts with adding something: more ads, another network, a new price. This field note goes the other way. In Metro y Metrobús, our own transit app, the revenue numbers looked healthy while some of the ads behind them trapped people on a screen they could not leave.
The revenue report looked fine. The ads did not
One evening in September we met two full-screen ads on our own Android phone that had no way out. Back did nothing. The only exit was the “Install” button, which sends someone who wanted a departure time to the app store.
No revenue number showed this: those ads were paid for like any other. Several ad networks compete for each ad slot, and the main network’s quality controls do not cover the others.
The first change was in the mobile app itself. If a full-screen ad still holds the screen after a set number of seconds, the app closes it and takes the person where they were going. We call that a rescue. It costs no income, because the ad has already been counted, and it records which network served the ad.
Is the data even right? Three corrections before any decision
A weekly review, today a routine in Butler, our AI development cockpit, reads those records and posts a short report. Its first three weeks were about the data itself.
- Week one: no numbers. The report said the analytics export did not exist. It did; a login had stopped working.
- Week two: counts without a base. There were 1,814 rescues but nothing to divide them by. We added a record for every full-screen ad shown, and raised the wait from 40 to 60 seconds, because at 40 a long video could be counted as a trap.
- Week three: a good-looking number was the problem. Two networks showed click rates of 55 to 75 percent, against 9 to 15 for the main one. Those clicks were people escaping through the Install button.
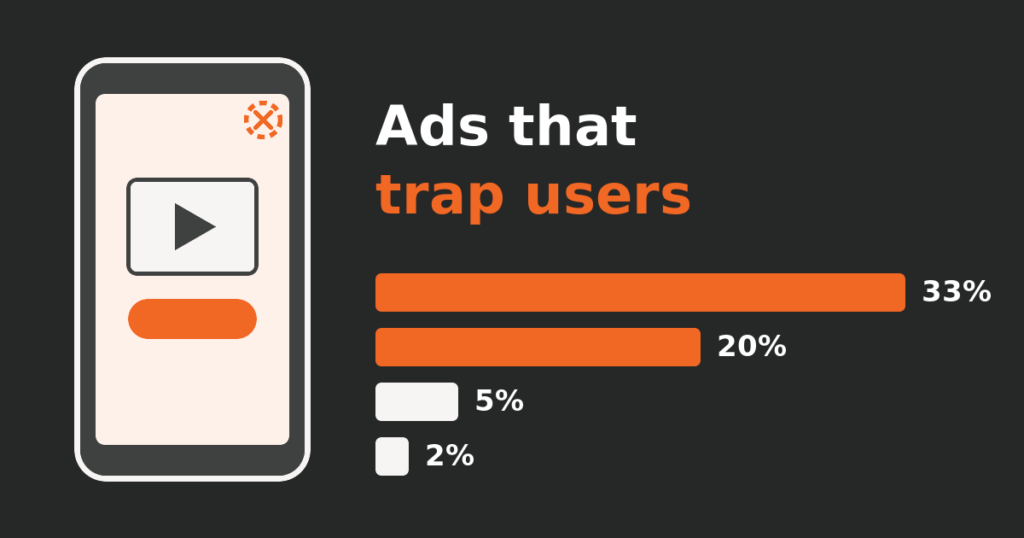
Now the networks could be compared. On Android, network A needed a rescue on 32.6 percent of its full-screen ads and network B on 19.9. The main network, our control, was at 1.9.
To increase app revenue we first gave some up
The report also said what the decision would cost. That week network A brought about 15 percent of Android’s full-screen ad income and network B about 2 percent. The recommendation, to switch off only their full-screen ads and keep their banners, waited for the owner.
Network A’s full-screen ads stopped on October 1. Network B went less well: the instruction to switch it off never reached the ad console. The weekly report caught it on October 12, still at 23.8 percent on Android. It was paused that day in both apps.
Afterwards, the share of Android full-screen ads needing a rescue fell from 7.2 percent to 2.1. Ad income over the 28 days to November 2 was 25.5 percent above the 28 days before. Many things changed in those weeks, so we do not credit the removal for the rise. We only say the loss we feared did not show.
The same habit in an online store
An online store in Mexico raised two red alerts in one week: 11 paid orders in seven days against a usual 23 or so, and a cart rate of 14.8 percent against 25. Data first: days earlier, 17 of 19 paid orders had reached analytics. With the reporting of purchases fixed, the check now read 11 of 11.
For six days a burst of search demand on one product page had brought 29 of the store’s 34 paid orders. Then the burst ended: visits landing on that page went from 395 to 41, and its orders to zero. Every device fell together and failed payments were normal. Nothing was broken, so no code was changed. What follows is search work, which is where marketing with numbers behind it starts.
Where the person came in
A person noticed the trapped ads, on a phone, before any report did. The routine counted, compared and recommended, but it does not change the ad setup: each recommendation went to the owner. Giving up income is the owner’s call. It is one of the moments where a person must say yes.
What to take from this
Before adding anything, ask of the income you already have: is the number right, what is it divided by, and what does it cost your users? For a second pair of eyes on your own numbers, book a free 30-minute consultation and project review.
Keep reading
 Field notes
How we automate bookkeeping so no invoice gets skipped
A field note from our own books: three AI routines chase tax invoices and check month-end gaps, a tile flags unpaid invoices. Real counts.
 Field notes
How long does it take to build a website? Ours took 5 days
Guides say a professional website takes months. Ours was live in under eight hours and ready for business in five days. The real log, errors included.
 Field notes
Mobile app maintenance with AI: a month of Metro y Metrobús
One month of looking after our own transit app with AI: a review fixed in a day, a cost alert traced to one feature, and where a person said go.